From Prompts to Perfect Graphs — Instantly.
Our AI understands your data, crafts the right visualization, and tells your story — all without touching your raw data.
"Show sales in October"
Line Chart
Bar Chart
Pie Chart
The Future of Data Visualization is Conversational
Imagine describing a chart — and watching it appear, intelligently crafted to fit your story. Our AI graph engine analyzes your data structure, identifies the most suitable chart types, and offers you tailored suggestions — always keeping performance, security, and design harmony in mind.
Speed
Security
AI Understanding
Aesthetic Intelligence
See It in Action
Three simple steps to transform your data into stunning visualizations.
Powerful Features
Everything you need to create, manage, and share intelligent data visualizations.
AI-Driven Visualization
Transform complex data into stunning visual stories using natural language prompts. Our AI understands context and automatically selects the best chart types for your data, making visualization effortless and intuitive.
BYOD Integration
Seamlessly connect to your existing data sources including Google Sheets, cloud databases, REST APIs, and more. No data migration needed—work directly with your data wherever it lives.
Zero Data Storage
Your privacy is paramount. We never store your raw data on our servers. All processing happens in real-time, ensuring your sensitive information remains completely under your control.
Snapshot Versioning
Capture and save different versions of your graphs as you iterate. Easily compare changes, rollback to previous states, and maintain a complete history of your visualization journey.
Narrative Intelligence
Let AI do the heavy lifting with automatic report generation, insight summaries, and trend analysis. Get actionable intelligence from your data without manual interpretation.
Team Collaboration
Work together seamlessly with real-time commenting, editing permissions, and approval workflows. Keep everyone aligned with full transparency and audit trails for all changes.
Dashboard Gallery
Explore the variety of intelligent dashboards you can create with Graph
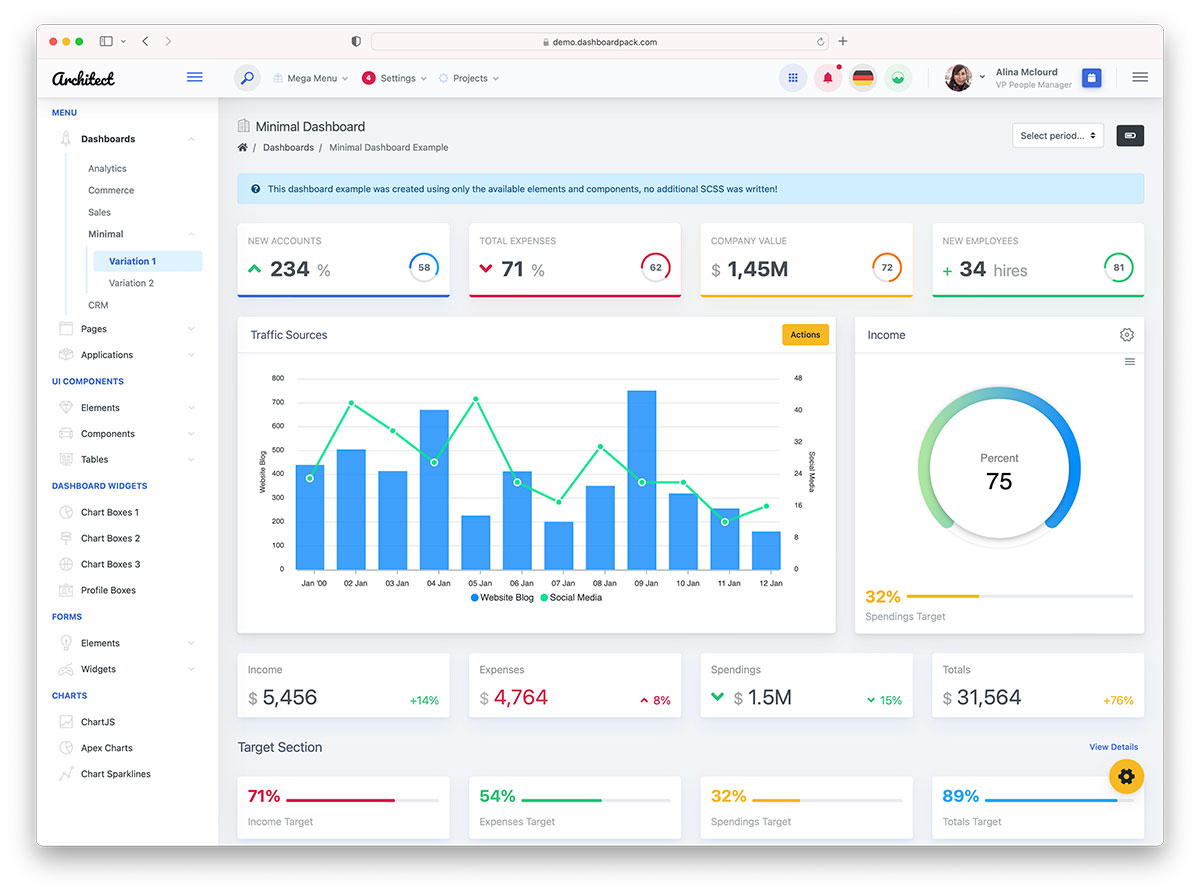
Analytics Dashboard
Track key metrics and visualize data trends in real-time
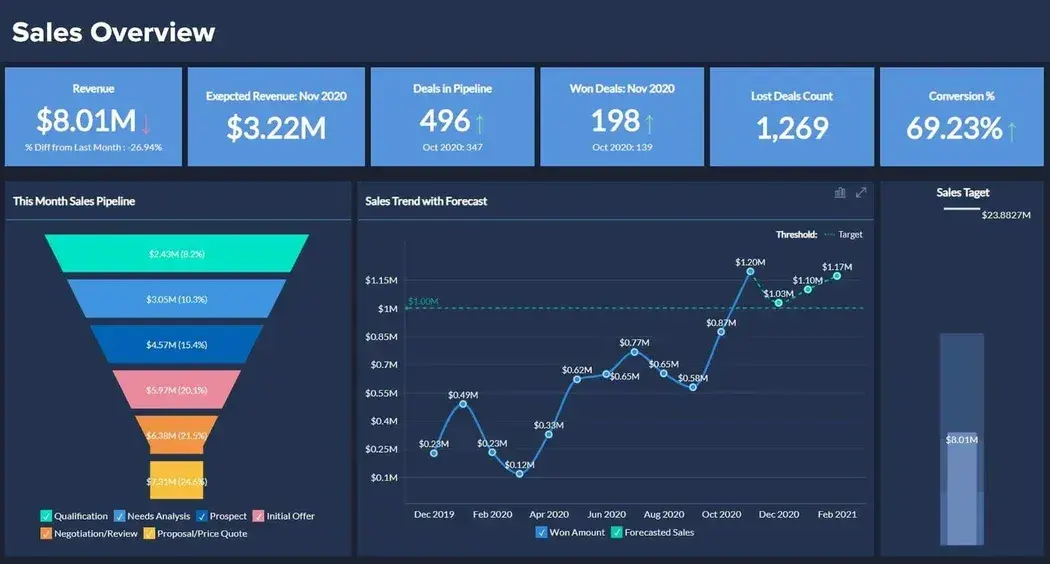
Sales Dashboard
Monitor sales performance and revenue growth
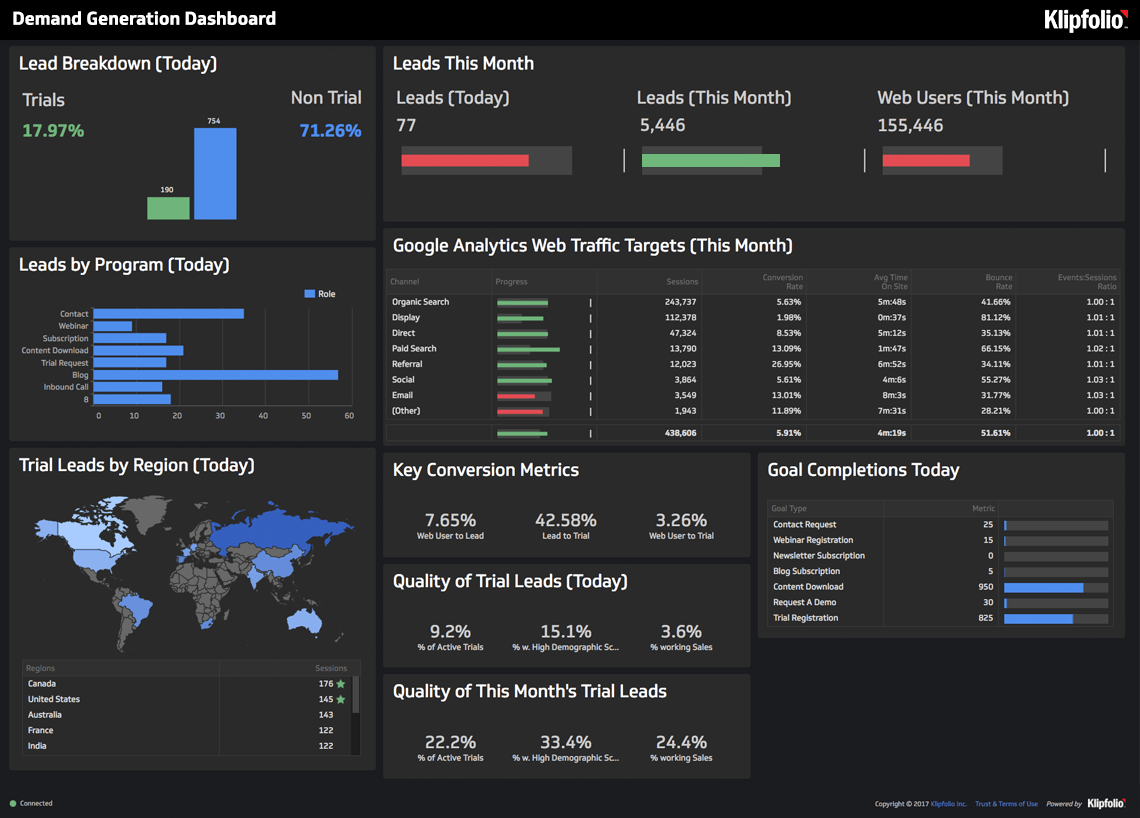
Marketing Dashboard
Analyze campaign performance and audience engagement
Project Management Dashboard
Oversee project timelines, tasks, and team productivity
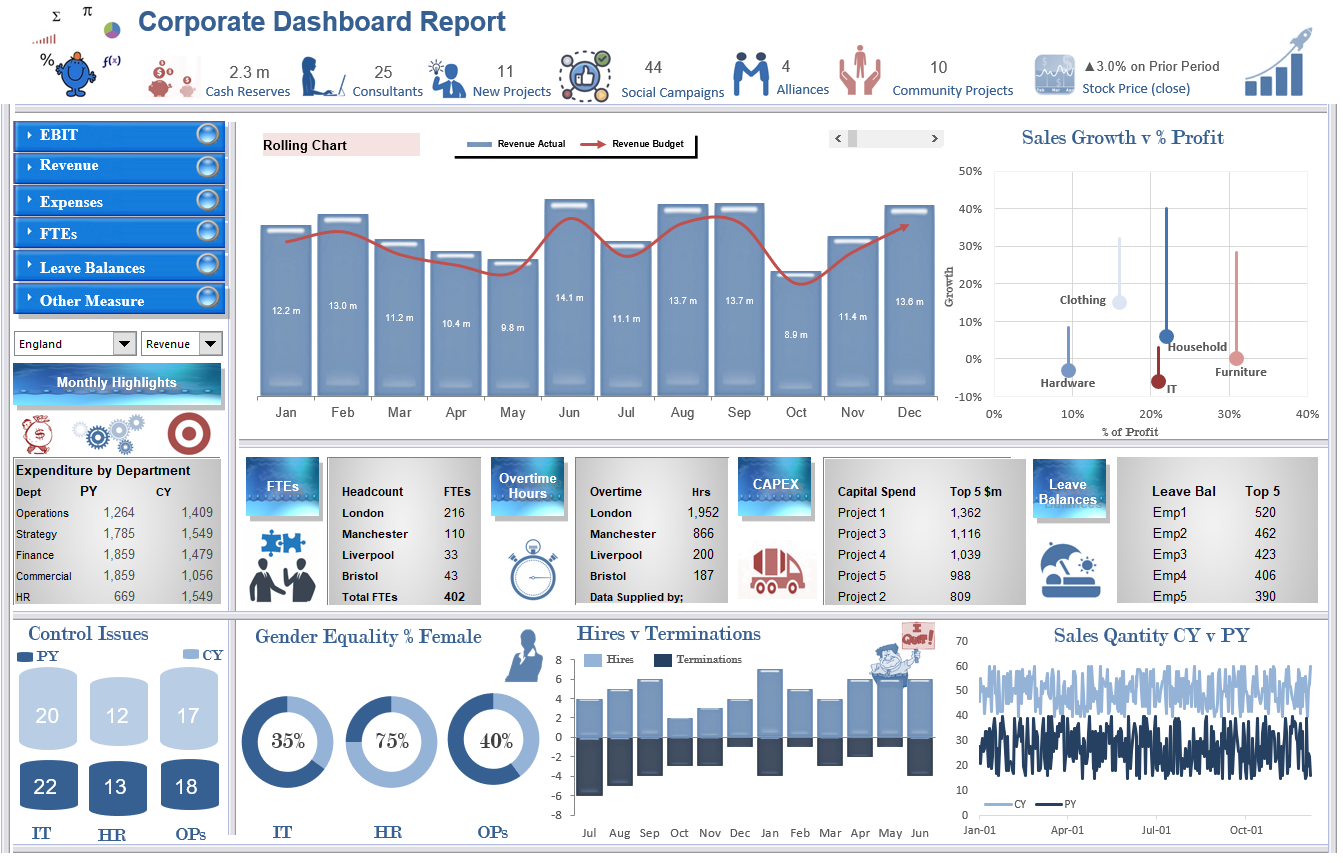
Financial Dashboard
Manage budgets, expenses, and financial forecasts
Loved by Data Professionals
See what our users have to say about transforming their data visualization workflow.
"It feels like having a personal data designer who understands my intent."
Priya Mehta
Product Manager
"The AI suggestions are spot-on, and the warning system saves me from messy charts."
Alex Carter
Data Analyst
"Finally, a visualization tool that respects my data's privacy."
Neha Sharma
BI Lead
Frequently Asked Questions
Everything you need to know about Graph.